

If the 1999 1st Edition Base Set Charizard once lived mainly as the glowing sheet in a collector's cabinet, and if most people still meet the Pokémon secondary market through twenty-dollar singles, raw listings, and weekend flea tables, then the UltraBall Research report fixed on 17 October 2026 rewrote that same pipeline into a spire. The window runs from 15 September to 14 October 2026: 460,549 English and Japanese sales of known price, totaling $198.6 million. The priciest 1% of sales—4,606 transactions at $5,520 or more—took 64.3% of the dollars. The image that runs through this piece is sixty-four percent in the spire against a twenty-dollar median. Dashboards like to shout "the market." The ledger stacks the money into a very narrow cell.
I lined up UltraBall's October edition, the venue share tables for the same window, and the rotation readings in TCGCharts Market Pulse for the week of 16 October 2026. This article quotes only public figures I checked. The morning piece covered Magic's thin-market percentage myths; this afternoon piece moves to Pokémon and asks which step of the staircase the dollars actually sit on.
1. The default grammar of "the market," and the priciest one percent taking sixty-four
Industry default logic is clean, and therefore lazy.
Talk about the Pokémon secondary market and the default story almost writes itself. Watch the median. Watch raw singles volume. Watch whether ungraded listings still feel busy. Median sale: $20. Sales under $20: 49.6% of transactions, more than 228,000 of them. The default logic therefore almost installs itself. Half the trades sit under twenty dollars, so the story becomes a mass market, or a flea table still discovering price.
UltraBall re-ranks the same sales by dollars. The priciest 1% took 64.3%. The priciest 10% took 90.2%. Sales of $25,000 or more numbered only 1,124—0.2% of sales—yet took 45.1% of dollars. That under-$20 half of the ledger contributed just 0.86% of the money, about $1.71 million. The median describes the floor of trade counts. The spire describes where dollars go. Two readings share the word "market" and answer two different questions.
Remove the 217 sales over $100,000 and the story still refuses to become a mass market. Those 217 sales totaled about $47.8 million, 24% of all dollars. After stripping them, the remaining ~$150.9 million still sent 53.8% to the priciest 1%. The spire does not lean only on seven- and eight-figure single auctions. Once that layer is gone, five-figure and high four-figure sales keep pushing money upward.
2. Graded paper takes ninety-two percent; four Mondays hold up Fanatics' forty-three
Trade counts and dollars split again on the graded cut.
Raw sales: 304,712, 66.2% of sales, only 7.8% of dollars, median $10. Graded sales: 155,837, 33.8% of sales, 92.2% of dollars, median $102. The graded median is about ten times the raw median. Watch only trade counts and raw looks like the body of the market. Stack dollars on top and the room looks more like a graded cabinet's spire. Fast-moving raw singles on the counter and PSA slabs that pile cash in the ledger belong to two different ledgers.
Venue share makes the spire concrete. eBay took 89.9% of sales and 47.9% of dollars, median about $19.99. Fanatics Collect held only 9.6% of sales yet took 42.7% of dollars, median about $26.40. Alt: 0.5% of sales and 9.1% of dollars. Goldin coverage is thinner. Fanatics dollars almost pack into four Mondays. 21 September, 28 September, 5 October, and 12 October 2026—four Sunday-night auctions—summed to about $79.98 million, 94% of Fanatics dollars in the window. One weekly auction night can rewrite a month's venue table. eBay owns counts and the median. Fanatics' four Mondays own the lift of the spire.
Cut again by card-and-grade combination: among 77,022 combinations with a sale, the top 1% (771 combinations) took 55.9% of dollars. By card and printing: among 26,571 cards with a sale, the top 1% (266 cards) took 54.9%; 209 cards (0.8% of cards that sold) already gathered half of all dollars. The top ten cards took 8.3%; the top hundred took 36.3%. Concentration repeats across rankings by single sale, by card-and-grade, and by card. The numbers float a little. The shape does not.
3. Gold Star Mudkip and 1st Edition Charizard, and old sets writing the rotation into the same week
Staring only at the 64.3% headline narrows the story into "money is concentrated." Point the camera at the cards that took the most dollars and you see who stands on the spire.
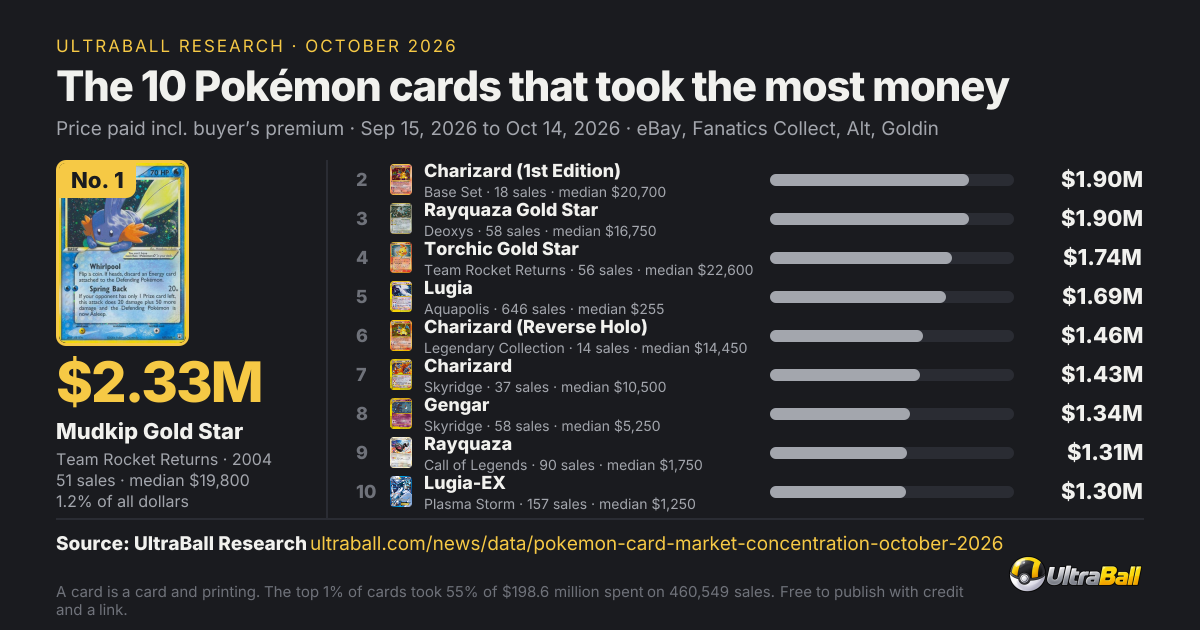
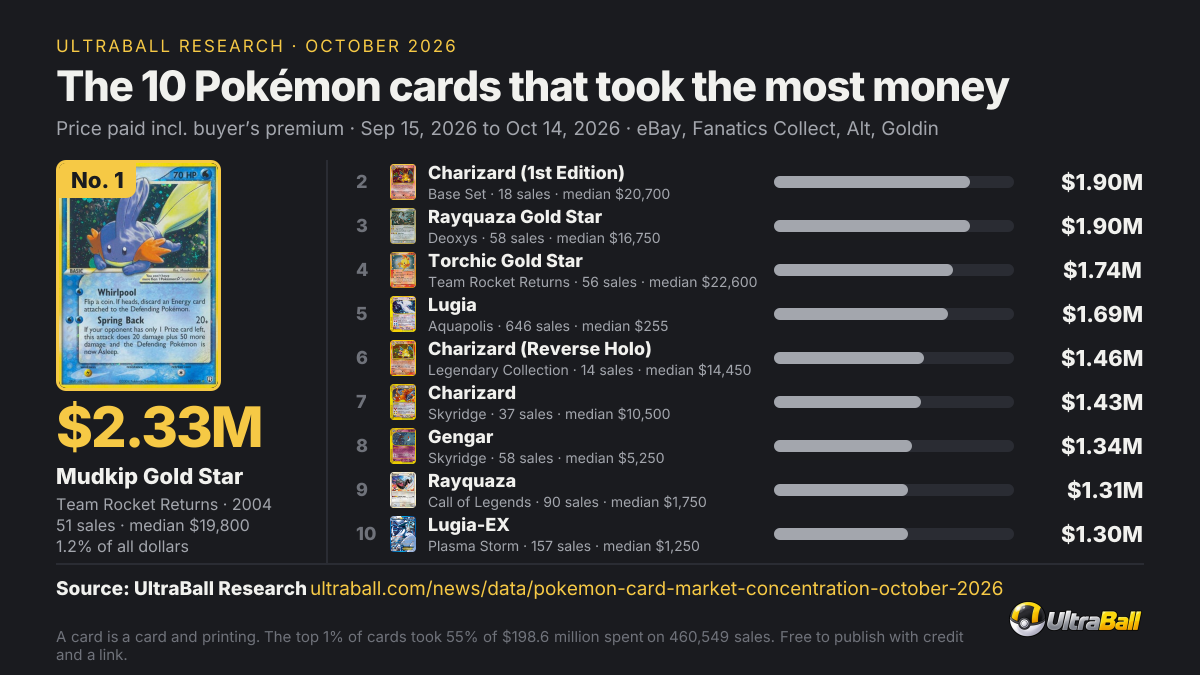
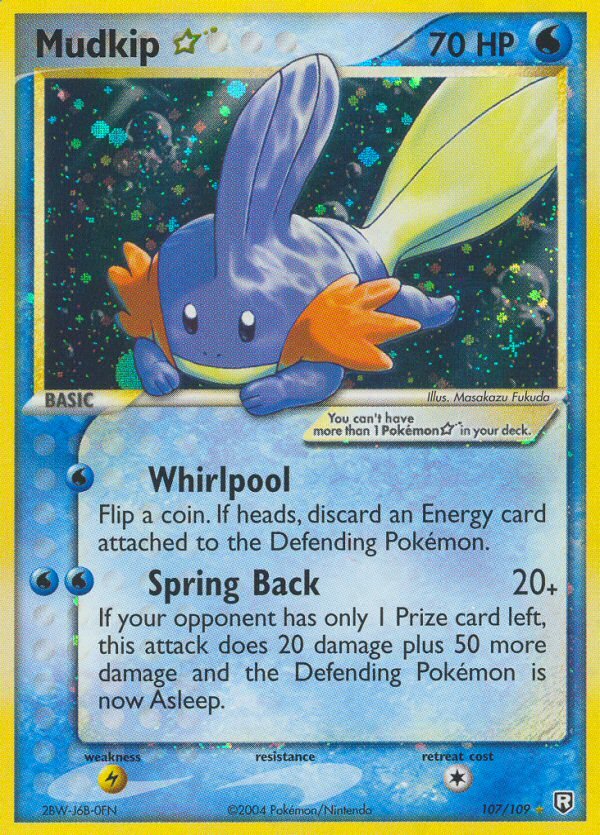
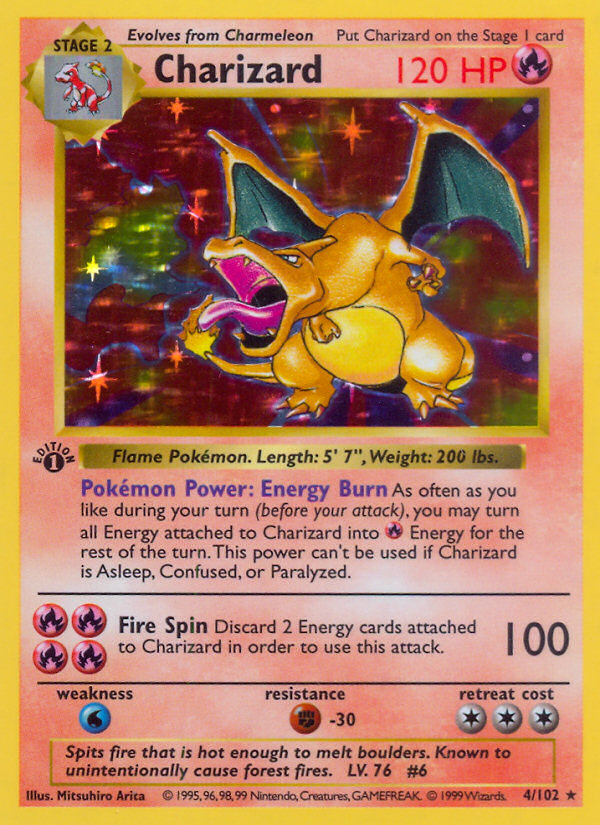
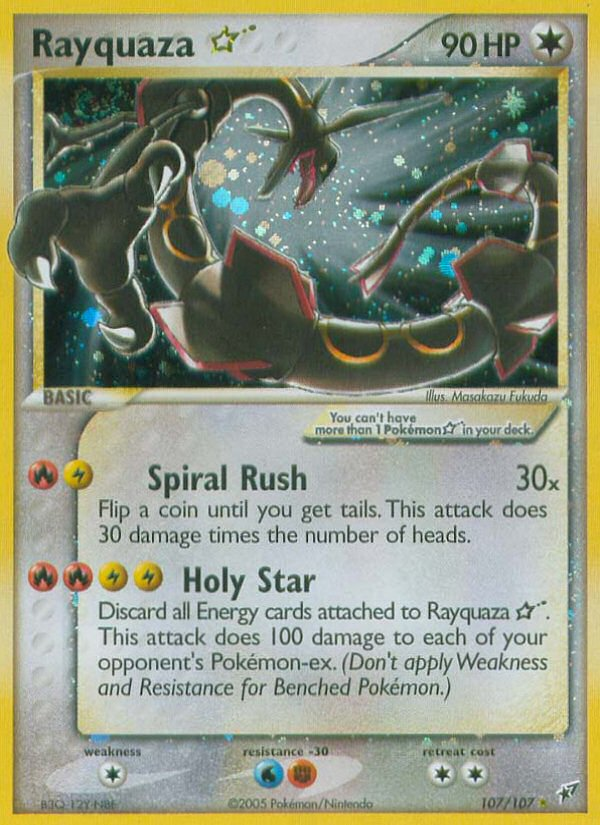
The card with the most dollars in the window was Mudkip ☆ (Team Rocket Returns, 2004), about $2.33 million across 51 sales, median about $19,800, with PSA 10 contributing roughly 44% of that card's dollars. 1st Edition Base Set Charizard about $1.90 million from only 18 sales, median about $20,700, PSA 10 about 73%. Rayquaza ☆ (Deoxys) about $1.90 million; Torchic ☆ about $1.74 million; Aquapolis Lugia about $1.69 million across 646 sales, median about $255, stacking dollars through volume. At set level, Legendary Collection (2002) took the most set dollars, about $13.88 million, 7.0% of the total. Nearly all of the top ten sets were printed between 1999 and 2011. Ascended Heroes (2026) can squeeze into the top twenty-five on 16,503 sales and about 1.1% share—not the same order as Legendary Collection's seven points.
The card-and-grade champion is blunter. 1st Edition Base Set Charizard PSA 10: one sale at $1,385,274, first on the combination board. Legendary Collection reverse-holo Charizard PSA 10: two sales totaling $1.26 million. Mudkip ☆ PSA 10: one sale at $1.02 million. All ten top combinations are PSA 10s. The tip of the spire is a handful of perfect slabs re-priced on a handful of auction nights.
TCGCharts Market Pulse (week of 16 October 2026) writes the same window's rotation as a cross-check. Pre-2011 PSA 10s: median card up about 36.7% over thirty days. 2011-and-later PSA 10s: median down about 7.3%. Pokémon 200 index at 2,911, about +5.0% in two weeks; Grail 25 about −0.6%; sentiment at Fear 39. Index recovery rides vintage; the Grail line, heavy in modern and Pikachu, retreats. UltraBall's concentration table explains where money stacks; TCGCharts' rotation table explains, in the same stretch of calendar, which slabs lift and which yield. Read together, October's Pokémon secondary floor looks more like dollars moving from wide modern slabs toward low-population vintage sets and Gold Star lines.
4. Return flow: read the dollar steps first, then the trade counts
What this data rewrites is the default referent of "the Pokémon market" on the secondary floor.
Before the spoiler, the market could be written as a twenty-dollar median, two-thirds raw by count, eBay at nine-tenths of sales. The 17 October UltraBall report writes the priciest 1% as 64.3%, graded as 92.2% of dollars, Fanatics' four Mondays as 42.7% of venue dollars, and 209 cards as half the money. Figures will wobble in the next edition. Median, raw counts, and eBay share will not vanish with the spire. They describe trade counts. The spire describes dollars.
The multiplier these thirty days wrote into the ledger is graded slabs times auction night times a very short card list. Single-card myth handles the eye catch. Under the eye catch sit the 0.86% dollar share from under-$20 sales, the 92.2% graded dollars, and the Fanatics share held up by four Mondays. Tear the poster and the concentration table remains.
If you want one trail only, open three pages at once. UltraBall's October concentration report: check $198.6M, 64.3%, 53.8% without the six-figure sales, and 209 cards for half. The same page's venue table: eBay 47.9% of dollars versus Fanatics 42.7%, with 94% on four Mondays. TCGCharts Market Pulse for the week of 16 October: vintage PSA 10 median about +36.7%, modern about −7.3%, Fear 39. Numbers will keep moving. Paper printed since 1999 has already been re-tagged by October's dollar steps. Whether the tag still matches payment and population is another ledger.
Close: secondary-market independence, refusing to merge mass trades and spire dollars under one median
Put Mudkip ☆, 1st Edition Charizard, Legendary Collection, and the four Mondays back onto the October 2026 Pokémon secondary floor, and the piece hits a quieter reading habit. People often translate median price straight into market temperature, and often crown the venue with the most trades as the pricing center. Two-thirds raw by count and eBay's nine-tenths of sales share one line—"the mass market is still here"—and the habit hardens.
The public counterexamples are concrete. 460,549 sales, $198.6 million; priciest 1% (4,606 sales) took 64.3%; still 53.8% after removing 217 sales over $100,000; top 266 cards took 54.9%, 209 cards made half; under-$20 sales were 49.6% of trades and 0.86% of dollars; graded 33.8% of sales took 92.2% of dollars; Fanatics 9.6% of sales took 42.7% of dollars, 94% of that on four Mondays; Mudkip ☆ about $2.33M, 1st Edition Charizard about $1.90M, Legendary Collection about $13.88M; TCGCharts vintage PSA 10 median about +36.7%, modern about −7.3%. Concrete, because it asks you to read dollar steps, graded share, and auction nights. Median and trade counts are clues, not verdicts.
Independence can be redefined here. Independence can mean insisting on separate books inside the same October tape. Mass trade counts are one book; spire dollars are another. eBay's median and Fanatics' Mondays also get separate lines. When you build a watchlist, write first which cards sit among the top 209, which dollars come from graded slabs, and which venue shares lean on four auction nights—then decide whether "the market is busy" is worth cash.
Short prompts you can run:
- When you read a median, split trade counts from dollar share; if under-$20 is half the trades and 0.86% of dollars, treat the median as noise floor.
- When you read "the market is rising," open graded versus raw; a 92.2% / 7.8% dollar split is closer to where money goes than total trade counts.
- When you read venue share, table Fanatics' four Mondays alone; 9.6% of sales versus 42.7% of dollars shows a weekly auction night can rewrite a month.
- When you read a single-card myth, check card dollars, card-and-grade combinations, and set share together; Mudkip ☆ across fifty-one sales and a 1st Edition Charizard PSA 10 in one sale are two spire shapes.
- When you read rotation, pair UltraBall concentration with TCGCharts vintage/modern PSA 10 median moves; concentration says where money stacks, rotation says who lifts and who yields.
October's concentration table is still writing nearly two hundred million into a spire, and the Pokémon secondary floor has not turned a twenty-dollar median into pricing power. For anyone watching Gold Star Mudkip and 1st Edition Charizard, the faces are still the 2004 and 1999 printings. The secondary market suddenly wrote the priciest one percent as sixty-four percent of dollars in thirty days, and still left half of all trades under twenty dollars. Someone has shown that dollars can grow a myth on a spire, while median price and trade counts belong to two different books.

Sources and further reading
UltraBall Research, Where the money goes in the Pokémon card market (October 2026)
TCGCharts Market Pulse, Week of 16 October 2026
pokemontcg.io Mudkip ☆ (ex7/107)
pokemontcg.io Torchic ☆ (ex7/108)